


When Löyly strikes again – pilot study findings
Löyly does not distribute evenly in a sauna room. Although a basic tenet of Finnish sauna design presumes we can systematically get good results by following the simple Law of Löyly principle, the results of our pilot experiment shows how uneven löyly can get horizontally speaking even in well-designed spaces and its variable speed in the room. This report also, for the first time, tries to name the components of the löyly envelope, in an attempt to provide terminology for a better understanding of löyly behavior. The study motivates further research to examine the three-idmensional distribution of löyly in real-world applications.
The research was done collaboratively with the author, Dr. Lassi Liikkanen (research design and data analysis) and data engineer Aapo Rista (data collection and measurement technology).
Research motivation
The increased moisture in the sauna air created by water hitting the hot rocks of the sauna heater is known to Finns as “löyly.”. It is widely acknowledged that löyly does not simply fill the sauna. As the evidence in favor of the “law of löyly” suggests, the relative vertical dimensions of the sauna determine both how the room heats up and where the löyly can be experienced.
The exact movements of löyly have not been extensively studied. In fact, there is very little work that has much relevance to the question. In 2013, the doctoral students at the University of Helsinki have reported a single experiment in which they tried to capture and then alter the movement of löyly on camera. Their methodology didn’t work as expected, but they claimed that they still proved that löyly concentrates on the corner diagonally from the heater (max. distance) and it got there at approximately 0,4 m/s.
In this decade, a French engineer Corentin MacQueron has actively pursued modeling as an approach to understand sauna dynamics. He has recently used Ansys Fluent computational fluid dynamics simulator to explore different sauna conditions with credible results. Corentin has put out several white papers on his sauna works that can be accessed on his ResearchGate page. Most relevant to the present inquiry, his model of (water) particle trajectories in sauna include an estimation of the velocity of steam inside the sauna. The velocities he finds are regularly under 0,2 m/s with the exception of the heater’s “plume” that accelerates up to 0,9 m/s directly above the heater.
In this study, the aim was to see if continuous measurement of humidity changes in a sauna could provide empirical evidence of löyly movements. While I have been for years occasionally publishing what I call “löyly graphs”, timelines of humidity profiles of sauna rooms and equating löyly with what happens in these graphs, I have always known they portray only a small portion of the potentially complex phenomenon that löyly creates in the sauna. It is expected that as the temperature conditions across the rooms change, so does the presence of löyly vary, but just how much?
Research questions
The research questions were as follows, here “löyly” refers to temporary increase in relative humidity:
RQ1: Does löyly move quickly away from the heater as expected by the simulation data?
RQ2: From the humidity data, can we make observations on how löyly has moved in the sauna room?
RQ3: Does löyly accumulate at a certain position, such as the diagonally opposite corner of the sauna?
RQ4: We expect löyly to distribute horizontally and vertically in the space above the heater but does löyly move upwards or downwards?
RQ5: Can we determine speed estimates for löyly movement?
Test setup
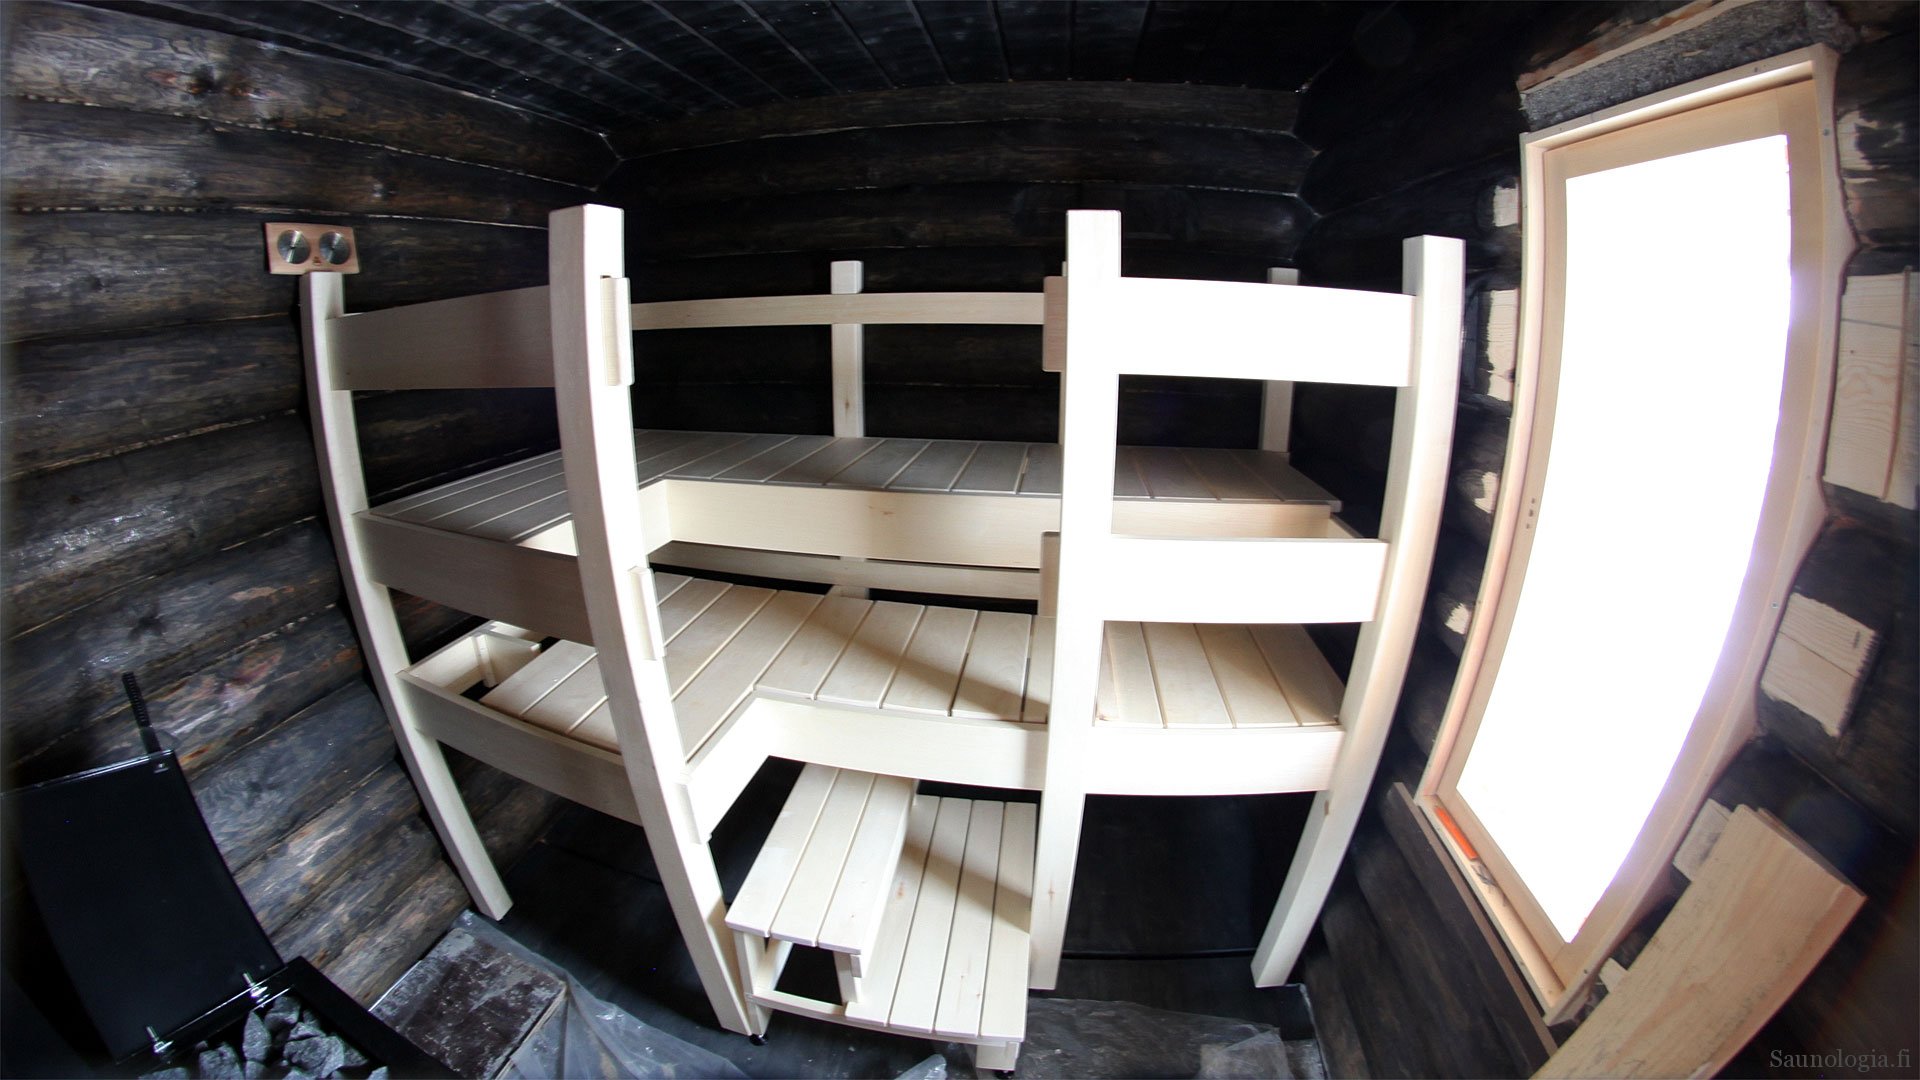
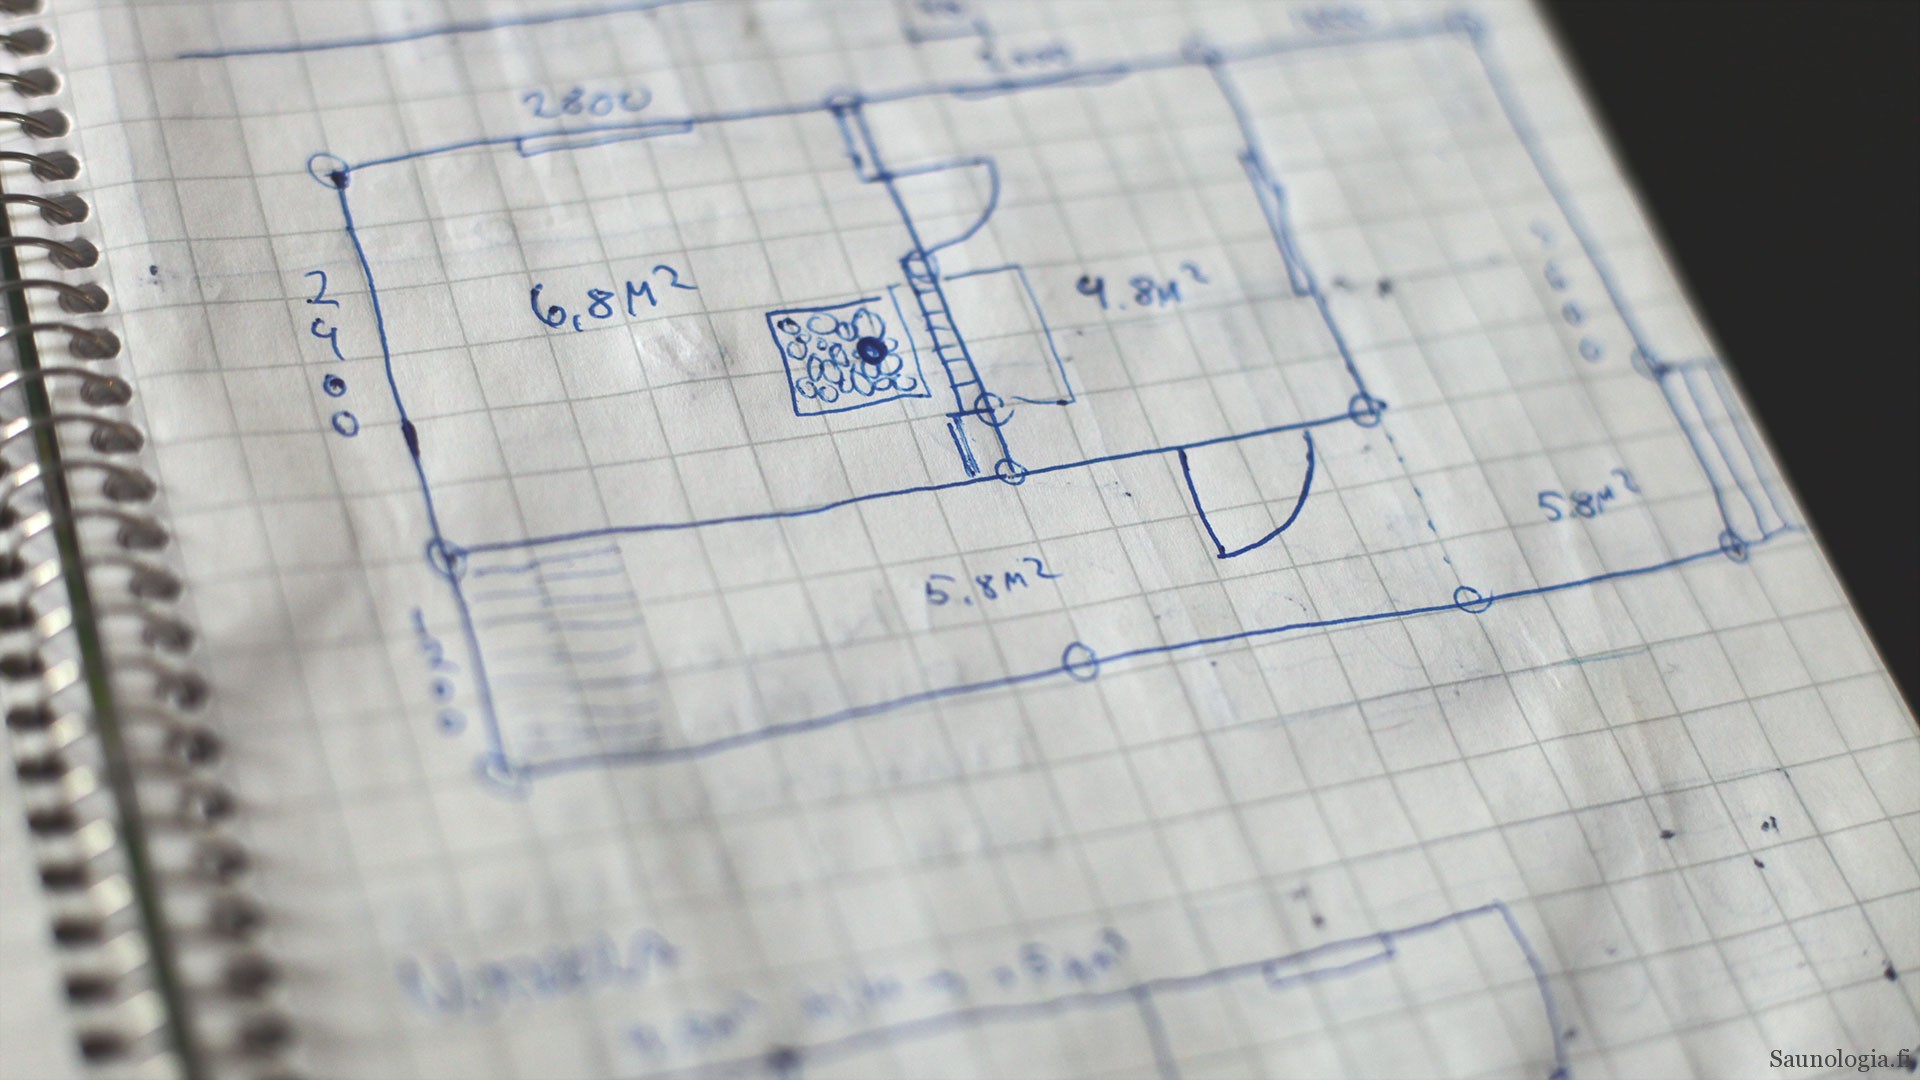
An experimental setup tracking the changes of sauna room humidity at three elevations (z), and five spots (xy coordinates, spots labeled A, B, C, D and X) at author’s Suvikallio sauna cabin. Due to physical limitations, eleven locations (xyz coordinates) were measured, more sensors could not be fit (11 out of maximum 15). The two highest elevation points (called 1 & 2 counting from the ceiling) were equally unobstructed so that there were no physical barriers within a 20 cm radius of each point. However, between X (the heater) and the B & C points, there were bench structures on lower elevations.

In the data, the sensors locations are named according to the following fashion:
A,B,C,D, and X are different X,Y coordinates, as illustrated in the Figure1. 1, 2 and 3 and vertical levels corresponding to 1: ceiling (-100 mm), 2: shoulder (-600 mm), and 3: knees (-1000 mm). The vertical levels were limited so that of the third level sensors, only A3 and D3 existed and on X, there was only the single sensor at the ceiling level (X1) because the heater’s proximity.
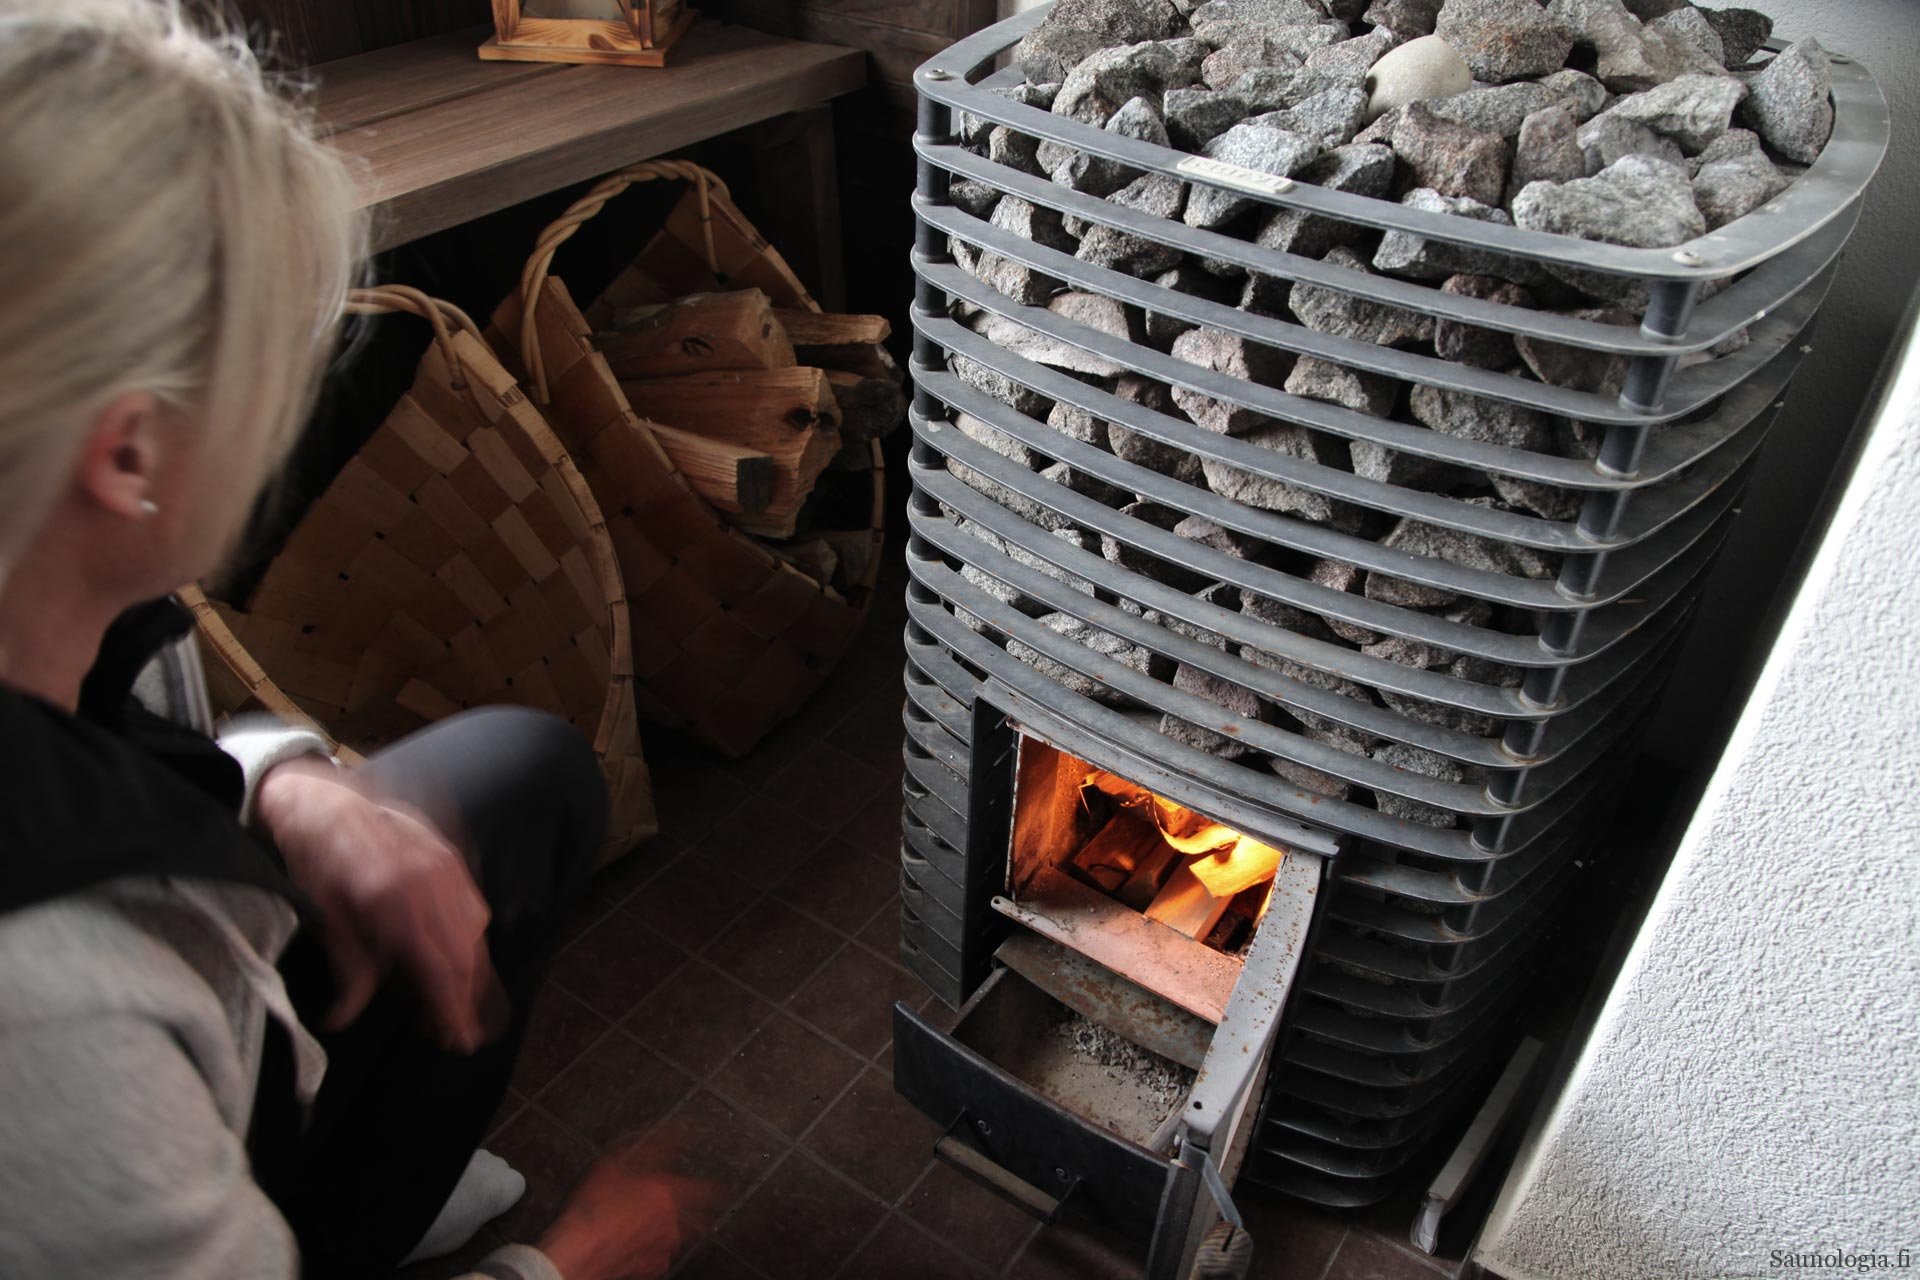
The sauna cabin uses a continuous wood-fired heater and natural ventilation. The heater is fed from the other room, minimizing the ventilation effect by burning wood and therefore making the experimental conditions more stable.
The measurement devices were Ruuvitag Bluetooth sensors that record both humidity (relative humidity; RH % was used here) and temperature (T in Celsius). The devices were deployed without their enclosure to maximize sensitivity and speed of humidity and temperature change. The Ruuvitags were using a custom firmware that allowed a faster than standard sampling rate. The data was harvested using a Ruuvi gateway that sent the data to a MQTT broker which deposited the packets eventually in an Influx database. A Grafana data visualization engine was then used for most of the data exploration and analysis.

The Ruuvitags have been successfully used by many hobbyists, including the author. They have an adequate temperature range and their sensitivity to humidity changes has been to be adequate in speed and dynamic range.
Test protocol
During a single sauna heating session in September, the cloud of 11 sensors was deployed and about forty minutes worth of data was collected. During that time, 200 ml of water was poured on the hot stones altogether 12 times. This was done in batches of 2, 6, and 4 pours with a 5-minute break to air the room in between. Each pour was done as quickly as possible to minimize variation due to administration. There was a pour-interval of approximately two minutes within each batch. During the batch, the sauna door and window were kept closed. After each batch, they were opened to air the room.
The sauna remained normally furnished during the experiment. The author LL administered the water doses manually while seated on the floor level in order not to interfere with the movement of air.
Data analysis
The exploratory data analysis was carried out by inspecting humidity graphs using Grafana and the numbers in Excel. Some more advanced analysis was done using Python with the assistance of ChatGPT o3. AI produced analyses were evaluated against a couple of calculations and visualizations produced manually to validate the approach.
In advanced analysis, the data was structured around the moments of löyly across the measurement points. A 50 second temporal window was used. The löyly responses were baseline corrected using the level of humidity just before the new löyly moment (50 seconds began) to reduce noise. Using the onset time of löyly attack (See Findings), averaging technique was also used to calculate average responses of löyly moment across the twelve moments present in the data.
Findings: data at a glance
Each sensor recorded over 11,000 data samples. Due to the nature of the measurement equipment, the samples are not at uniform intervals but on average we had five samples per second per sensor which allows downsampling for the analysis that was done on a second level.

The data has captured the moments of löyly well and matching the expectation (see image below). There are instances in which the sensor measurements hit the ceiling (100 % RH; also literally this happened at the ceiling level), but most of the time the data is credible showing more than random noise.
Another observation is that the humidity at all levels accumulated along the span of the measurement. This means the baseline humidity shifted over time and we could say that the signal-to-noise ratio got worse over the span of the experiment even though the peaks remained visible.
Findings: the löyly envelope and its components
To assist in the description of the results, I will refer to a new concept called löyly envelope. The envelope contains the time series during an increase in humidity is detected to a point in which the speed of change in humidity has decreased in This is a simple analogy from other domains of signal analysis (audio, brain waves, etc.), in which the unit of analysis is anchored on an event and unfolds after that. The event here is the creation of löyly and the envelope is the following change in humidity measured by a sensor.

The envelope can consist of an initial attack, consecutive attacks, sustain, and decay. All components do not appear in every envelope (see an application of this terminology on Walker Angell’s characteristics of steam story here)
The standard form observed at most events is an attack and decay. The humidity peaks in under five seconds of the löyly pour and decays in about 30-40 seconds.
 We also observe several instances of consecutive attacks after decay has seemingly started. This I interpret as the arrival of a new wave of steam arriving at the sensor location. This happens occasionally at most locations, but is most pronounced at lower heights (shoulder level). There it might be due to “descending” humidity that is decaying at a higher point and mixing with the lower level, or alternatively it is coming from another horizontal direction.
The other envelope form variation involves a long sustain. In the figure below, captured at the location C (furthest away from the stove), we can see the ceiling sensor (C1) humidity topping out for a long time, accompanied by the lower sensor (C2) with elevated readings in a similar time scale. There we see at least one clear consecutive attack and then minor fluctuations before the decay evidently starts some 50 seconds after the initial attack. These data match subjective assessment of löyly quite well, as the particular C corner is my favorite spot in this sauna – as it does seem to attract the most of löyly.

Findings: answers to the research questions
RQ1:Does löyly move quickly away from the heater as expected by the simulation data?
There are notable differences in löyly envelopes across the five spots. First of all, directly above the heater (spot X1), the envelope is usually short and any signs of consecutive attacks appear quickly if at all. This should be interpreted as the effect of the heater constantly keeping the convective loop in motion. It also corresponds to the subjective observations of water evaporating in seconds and steam quickly moving on. The answer to the first question is clearly “yes.”
The spot closest to heater (A) behaves somewhat similar to X1. There, the decay is also rapid and consecutive attacks are rarely observed. But importantly, we also observe a nearly total lack of humidity on lower levels (A2 & A3). This means that löyly practically evades the spot.

RQ2: From the humidity data, can we make observations on how löyly has moved in the sauna room?
The data shows consistent patterns of the löyly effect on humidity across the twelve löyly moments. Although the resulting envelopes have variance, the averaged responses show consistent waveform demonstrating attack and decay. The other components get lost in this relatively small data set.
Deducing the movement of the löyly cloud is less clear and although there are repeated and logical findings, for example spot D behaves against expectations as the response over there is much different from the A corner on the same wall and löyly seems to get there the last despite its proximity to the source (X).

RQ3: Does löyly accumulate at a certain position, such as the diagonally opposite corner of the sauna?
The löyly does indeed seem to accumulate in the spot furthest away from the heater (C). We see that in the example envelope, humidity saturates at C1 for an over 30 seconds sustain before decay. The same shows in the average response although not so pronounced. At C2, there is no similar saturation but sustain of over 45 seconds followed by gentle decay, indicating a smooth trace of löyly.


If we compare visually the envelope of C and B spots on the average response, both distant from the heater, it appears that at C2 spot, we commonly see consecutive attacks which may indicate additional humidity reaching this spot later.
RQ4: We expect löyly to distribute horizontally and vertically in the space above the heater but does löyly move upwards or downwards?
The data can not tell for sure about vertical movements. It is suggestive of the pattern that initially most steam heads up to the ceiling and then moves lower, but never rises further. On the other hand, the existence of attacks at the level 2 and the minor delay of the initial attack bespeaks of the idea that steam always first reaches the highest point (level 1) and the secondary attack at level 2 results from level 1 humidity falling down.
RQ5: Can we determine speed estimates for löyly movement?
The speed of löyly is not easy to determine from the data. The best estimate is calculated from the difference from the end of first attack between the different Level 1 measurement points. Based on the distances from X1 to A,B,C, and D points and the difference in timing, the first wave of löyly seems to travel from 0,14 to 0,28 m/s where the highest speed was recorded between X1 and B1. There was much variability in the results, but the attained figures resemble those reported by earlier research.
Findings: exploring absolute humidity
By a unit conversion from RH to Absolute humidity using Magnus–Tetens saturation‑vapour‑pressure equation, the following graph about events at different Level 1 measurement points was produced. This visualization is somewhat more informative when it comes to the visual comparison of different spots, but the envelope form remains identical to RH based graphs.


This visualization demonstrates again that löyly reaches the closest spot (A) first and clear increases over baseline humidity. The spot D remains an outlier with its surprisingly delayed and diminished response, as seen in previous RH comparisons.
Disclaimers
The pilot test setup had several flaws that could be improved upon in the future. The sauna’s ventilation was limited, and humidity started accumulating. While realistic, this clearly affected the data as the experiment progressed.
For data analysis, using absolute humidity as the dependent variable would help in fast comparisons at the different measurement points. On the other hand, as the data was converted to absolute humidity based on temperature and humidity data, the main results remained very similar, partially thanks to baseline correction. So this should not be taken as a major problem.
Python code created by ChatGPT was used in the data analysis. With better human resources, the code could be reviewed by a human expert and the analysis likely much improved.
Ideas for future research
The experiment should be next repeated in a different setting. Using a sauna with mechanical ventilation and a steady-state heater (electric preferably, heat storage would be okay too) would reduce experimental noise. For purposes of doing similar analysis, one might add some additional sensors, but without more sophisticated methods, that would add little value. Doing the experiment in a much larger sauna would provide additional temporal variance to the data and also check if some phenomena recorded here (consecutive attacks, sustain, difference between spots) will be found in other locations .
The research questions that are most in need of replication have to do with the vertical movement of steam and horizontal concentration in certain spots. It would be valuable to have measurement points further down (if possible) and possible somewhere along the wall, not just in the corners.
The data set is available for interested parties, please request over email: info@saunologia.fi
Huge thanks go to Aapo Rista for making this work possible and to all individuals who commented on the manuscript!
Disclosures
AI tools were used for data analysis and creating the feature image.


Hi Lassi,
great job. I love that you keep researching the principles of sauna physics.
One practical question: I want to sit in point C that gives the longest lasting löyly. How do you get the water on the stones? Do you walk to the heater and then quickly back on point C? Or do you throw the water across the sauna?
Greetings from Germany.
Thanks Tim,
The answer is simple, I just use a ladle with a super long handle (1,5 meters).
It is briefly mentioned here sauna ladle test 2017
Mielenkiintoinen tutkimus, jota en uskonut tarvitsevani lukea, mutta jonka lukemiseen käytin keskiviikkoiltapäivän katumatta!
Kiitos kiitos, joskus hyvät asiat yllättävät 😀
Kiitos, että jaoit tämän kiehtovan tutkimuksen löylyn käyttäytymisestä saunassa! On todella mielenkiintoista nähdä, miten löyly ei jakaudu tasaisesti, vaan sen liikkeet ja kertymät vaihtelevat saunan eri osissa. Erityisesti käsite “löylykuori” ja sen eri vaiheet, kuten “attack” ja “decay”, tuovat uutta ymmärrystä löylyn dynamiikasta. Tutkimuksen havainnot, kuten löylyn kertymä saunan vastakkaiseen nurkkaan ja sen liikkeen nopeus, tarjoavat arvokasta tietoa saunan suunnitteluun ja löylynautinnon maksimoimiseen. Tämä tutkimus avaa uusia näkökulmia saunomisen fysiikkaan ja inspiroi syventymään aiheeseen entistä enemmän.